
Structured abstract
The observation, in context.
- Objective
- To describe body-weight and HOMA-IR changes during the first 12 weeks of treatment and interpret them alongside the clinical activity record.
- Methods
- Retrospective descriptive analysis of one participant’s case summary, laboratory extracts and recorded treatment activity. Weight change and relative HOMA-IR change were calculated from the reported values. The study had no comparator.
- Results
- Body weight was reported as 96.5 to 86.5 kg, a 10 kg reduction (10.4%). Recorded HOMA-IR changed from 3.3 (Week 2) to 0.9 (Week 12). HbA1c was 5.5%, reported as normal range.
- Interpretation
- Body weight and the HOMA-IR index decreased over their respective observation windows. The findings describe this participant’s course of care; the single-patient design does not isolate a treatment effect or establish long-term maintenance.
Case presentation and methods
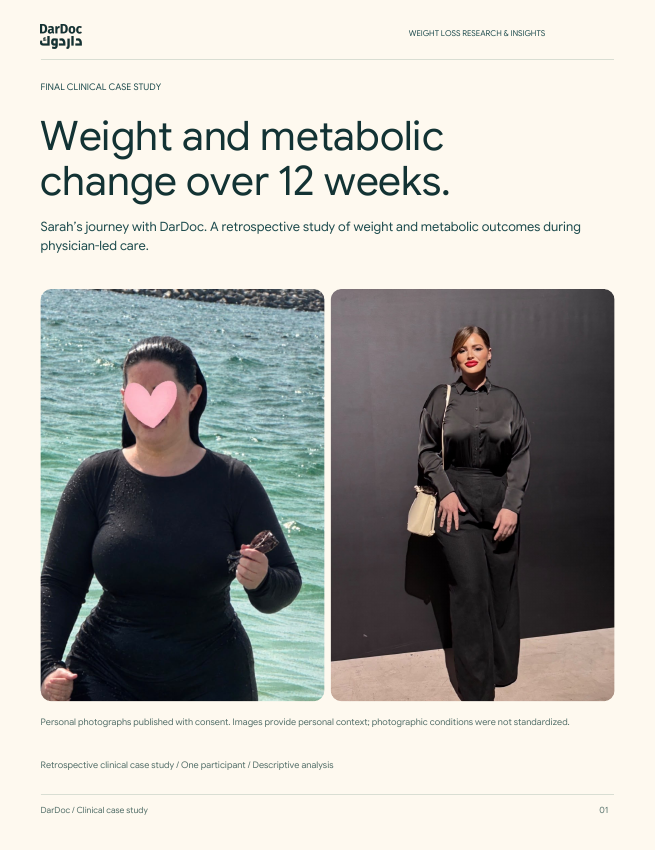
This study describes Sarah’s care with Wegovy (semaglutide) injections over 12 weeks. Weight values are summary-reported; HOMA-IR values are transcribed from laboratory extracts. We preserve that distinction in the outcome record. Her photographs and video contribute personal context and do not validate the numerical endpoints.
The supplied DarDoc patient chart records a 33-year-old female participant.
Baseline clinical assessment
Recorded height is 160 cm. Using that height and the reported weights, calculated BMI is 37.7 kg/m² initially and 33.8 kg/m² at Week 12. These calculations use the case-summary weights, rather than the separate dashboard snapshot weight.
The supplied patient chart records: chronic illnesses — none reported; allergies — no known drug allergies; cancer or tumour history — no cancer or tumour history reported.
Waist circumference, examinationfindings, presenting symptoms and a clinician-confirmed diagnosis were not supplied. Relevant medical and family history, concomitant medicines and previous treatment attempts were not captured in the study dataset. Prescribing eligibility and disease severity cannot be reconstructed from body weight and HOMA-IR alone.
Analytical approach
We show the available endpoints without imputing missing observations. Relative changes use each measure’s first available value and are rounded to one decimal place. No hypothesis test, confidence interval or estimate of population effectiveness is assigned to this individual record. The reporting structure draws on CARE guidance for clinical case reports.9
Treatment and clinical follow-up
This report covers the first 12 weeks. Treatment started on 6 Jul 2026; the Week 12 weight was recorded around 28 Sept 2026. Treatment is ongoing. The first HOMA-IR result belongs to Week 2, not a pretreatment baseline, and the retest belongs to Week 12. Exact specimen collection dates were not supplied.
| Event | Available record | Measurement context |
|---|---|---|
| Programme start | 6 Jul 2026 | Reported treatment start; consultation and administration are distinct records |
| First HOMA-IR result | 3.3 · Week 2 | First available index; fasting inputs were not included in the dataset |
| Treatment interval | 12 weeks, reported | First outcome window; treatment continued beyond this interval |
| Week 6 weight | 90.9 kg · 5.6 kg below starting weight | Calculated from the reported Week 6 reduction of 5.6 kg from 96.5 kg; not an independently supplied scale reading. |
| HOMA-IR retest | 0.9 · Week 12 | Repeat index; exact specimen date and assay comparability were not documented |
| Follow-up weight | 86.5 kg · Around 28 Sept 2026 | Approximate follow-up date; weighing conditions not recorded |
Reported checkpoints are shown separately, with their source. No measurements are interpolated between checkpoints; a programme week is not an exact laboratory collection date.
Documented prescription and delivery history
| Date | Record type | Recorded event |
|---|---|---|
| 23 Jul 2026 | prescription | Wegovy 1 mg prescribed |
| 4 Sept 2026 | review | Consultation completed and outcome recorded by Dr. Sami |
| 4 Sept 2026 | prescription | Wegovy 1.7 mg prescribed |
| 5 Sept 2026 | delivery | Wegovy 1.7 mg delivered |
| 1 Oct 2026 | prescription | Refill and prescription recorded by Dr. Sami; stay at current dose |
| 5 Oct 2026 | prescription | Wegovy 2.4 mg prescribed |
| 6 Oct 2026 | delivery | Wegovy 2.4 mg delivered |
Prescriptions and deliveries document recorded supply and follow-up. They do not establish each administered dose or a complete titration schedule.
The clinical outcome record
10 kg
10.4% of starting weight3.3 → 0.9
72.7% relative reduction in the index| Measure | Starting / first available | Follow-up | Evidence status |
|---|---|---|---|
| Body weight / kg | 96.5 | 86.5 | Case summary; Week 12 around 28 Sept 2026 |
| HOMA-IR / index | 3.3 | 0.9 | Week 2 → Week 12; first value is not a pretreatment baseline |
| Week 6 body weight / kg | — | 90.9 | Calculated from the reported Week 6 reduction of 5.6 kg from 96.5 kg; not an independently supplied scale reading. |
| BMI / kg/m² | 37.7 | 33.8 | Calculated using recorded height 160 cm |
| HbA1c / % | 5.5 · Normal range | Single reported result; measurement date not supplied. No paired change calculated. | |
| Fasting glucose / mmol/L | NR | NR | Needed to audit HOMA |
| Fasting insulin / µU/mL | NR | NR | Needed to audit HOMA |
| Waist circumference | NR | NR | Waist measurement not supplied |
| Lipids | NR | NR | No lipid outcome supplied |
| Blood pressure | NR | NR | No haemodynamic outcome supplied |
| Liver and renal markers | NR | NR | Monitoring records not supplied |
| Adverse events / adherence | NR | NR | Not systematically documented |
NR = not reported in the supplied material. It does not mean normal, absent or unchanged.
Magnitude and measurement quality
Absolute weight reduction is 96.5 − 86.5 = 10 kg. Relative reduction is (10 / 96.5) × 100 = 10.4%. Exact weighing dates, scale, calibration, clothing and time of day were not documented. No body-composition measurement was supplied, so fat-versus-lean loss cannot be described.
HbA1c context
The supplied HbA1c result is 5.5%, reported as normal range. NIDDK describes HbA1c below 5.7% as the normal range. This is one result with no paired change or measurement date supplied; it does not establish diabetes remission or replace a physician’s assessment.10
Interpreting the metabolic signal
The absolute HOMA-IR difference is 2.4 index units. The 72.7% reduction describes a calculated index; it is not a measured percentage recovery of insulin sensitivity or a percentage reduction in diabetes risk.
What is being estimated?
HOMA models the fasting, steady-state relationship between glucose and insulin. The original HOMA1 approximation is fasting insulin (µU/mL) multiplied by fasting glucose (mmol/L), divided by 22.5. HOMA2 uses a computer model and is not interchangeable with that simple equation. Assay variation and pulsatile insulin secretion affect estimates; model version and sample conditions belong in the methods record.2
HOMA1-IR = fasting insulin × fasting glucose22.5
HOMA estimates insulin resistance rather than measuring it directly. The original model was evaluated against clamp-based assessments. A longitudinal index is useful only when its inputs and collection conditions are understood; a change in the reported index alone cannot identify whether glucose, insulin, or both changed.3
The laboratory reference and its boundary
The supplied report lists HOMA-IR below 1.0 as insulin-sensitive. Its follow-up index falls within that report’s stated reference category. Reference thresholds require context. In a national Iranian analysis of 3,071 adults aged 25–64, investigators derived cut-offs for identifying metabolic syndrome within that population. Such work illustrates why a laboratory reference is not a universal diagnostic boundary. Population, assay and the outcome being classified must be specified.8
The laboratory labels values above 1.9 as early insulin resistance and above 2.9 as significant insulin resistance. Its Week 2 index exceeds the latter threshold; its follow-up index is below the stated insulin-sensitive threshold of 1.0. These are the reporting laboratory’s categories and require clinical interpretation.
Original glucose and insulin values, fasting preparation, assay comparability and HOMA version remain unverified. We cannot independently audit the index or determine whether the change was driven by glucose, insulin or both. This limits diagnostic interpretation.
The biology behind appetite

In a randomized, double-blind crossover experiment involving 30 adults with obesity, 12 weeks of semaglutide titrated to 1.0 mg reduced total ad libitum energy intake across measured meals by 24% versus placebo. Appetite and eating-control measures also improved. The experiment supports an appetite-related mechanism; it does not establish any individual participant’s dietary intake or treatment dose.4
Appetite, fullness and food intake were not measured with validated questionnaires or food diaries in this study. The published mechanism provides biological context; it does not establish this participant’s energy intake or explain the weight change on its own.
Published evidence, with its methods
Controlled trials provide context for treatment and follow-up. Their populations, doses, endpoints and timeframes must remain visible. They cannot fill gaps in an individual’s clinical record.
The STEP 1 randomized trial1
- Population
- 1,961 adults without diabetes; BMI ≥30, or ≥27 with a weight-related condition.
- Design
- Double-blind, 2:1 randomization; subcutaneous semaglutide 2.4 mg weekly versus placebo, both with lifestyle intervention.
- Endpoint
- Mean weight change: −14.9% versus −2.4%. Estimated difference: −12.4 percentage points (95% CI −13.4 to −11.5; P<0.001).
These are group averages at a different timepoint. An individual short-term observation cannot be ranked against the trial mean or treated as a controlled treatment effect.
The SELECT cardiovascular outcomes trial5
- Population
- 17,604 adults aged ≥45 with established cardiovascular disease and overweight or obesity, without diabetes.
- Design
- Semaglutide 2.4 mg weekly versus placebo; mean follow-up 39.8 months.
- Endpoint & safety
- Primary cardiovascular events: 6.5% versus 8.0%; hazard ratio 0.80 (95% CI 0.72–0.90). Permanent discontinuation due to adverse events: 16.6% versus 8.2%.
The endpoint combined cardiovascular death, nonfatal myocardial infarction and nonfatal stroke. The trial population and endpoint differ from a short-term weight and HOMA-IR case. A HOMA-IR change cannot substitute for an adjudicated cardiovascular event outcome.
What happens after treatment withdrawal?6
The exploratory STEP 1 extension followed 327 participants. After semaglutide and structured lifestyle intervention were withdrawn at week 68, the semaglutide group regained 11.6 percentage points by week 120, following a 17.3% mean loss in that subset. Net loss from baseline was 5.6%. The subset differs from the full trial analysis, and the extension was observational.
Short-term follow-up cannot establish maintenance. Later weight, treatment status and metabolic measurements are needed to describe durability.
Treatment exposure and tolerability
The June 2026 US label describes GLP-1 receptor activity, appetite-related reduction in calorie intake, glucose-dependent insulin secretion and glucagon suppression. It lists gastrointestinal reactions and warnings including pancreatitis, gallbladder disease, volume-depletion-related kidney injury and hypoglycaemia with insulin or secretagogues. Contraindications include personal or family history of medullary thyroid carcinoma, MEN 2 and serious hypersensitivity. This reference does not replace UAE prescribing information.7
The individual safety record
No adverse-event record, active symptom assessment, medication interruption history or adherence documentation was supplied. Tolerability therefore cannot be assessed from this material. A missing record cannot be turned into a statement that treatment caused no side effects.
Prescription and delivery events established recorded medication supply. An administration log, adherence measure and systematic adverse-event assessment were not part of the study dataset. The case therefore does not estimate a dose-response relationship or adverse-event rate.
Wegovy injection safety informationClinical discussion and limitations
Concordant change does not isolate a cause
The available weight and HOMA-IR values moved in the same direction. They also have different sources and unresolved specimen collection dates. Changes in nutrition, activity, other medicines, illness, fluid balance and analytical conditions have not been characterized. Their contribution cannot be separated from medication exposure in this record.
Selection and generalizability
A participant selected for an illustrative story may differ from patients with a smaller response, incomplete follow-up or discontinuation. One selected case cannot estimate a treatment response rate, average effectiveness or frequency of harms. Photographs provide personal context, not a validated body-composition endpoint.
The conclusion supported today
During the reported programme, available body-weight and HOMA-IR values were lower at follow-up. The changes are descriptive findings from a retrospective clinical case study. Attribution is limited by the absence of a comparator, complete fasting inputs and standardized measurement conditions. The observation window does not establish maintenance after treatment withdrawal. No cardiovascular, diabetes-remission or body-composition outcome is established by this case.
References and reporting notes
- Wilding JPH et al. Once-weekly semaglutide in adults with overweight or obesity. N Engl J Med. 2021;384:989–1002.
- Wallace TM, Levy JC, Matthews DR. Use and abuse of HOMA modeling. Diabetes Care. 2004;27:1487–1495.
- Matthews DR et al. Homeostasis model assessment: insulin resistance and beta-cell function from fasting plasma glucose and insulin concentrations in man. Diabetologia. 1985;28:412–419.
- Blundell J et al. Effects of once-weekly semaglutide on appetite, energy intake, control of eating, food preference and body weight in subjects with obesity. Diabetes Obes Metab. 2017;19:1242–1251.
- Lincoff AM et al. Semaglutide and cardiovascular outcomes in obesity without diabetes. N Engl J Med. 2023;389:2221–2232.
- Wilding JPH et al. Weight regain and cardiometabolic effects after withdrawal of semaglutide: the STEP 1 trial extension. Diabetes Obes Metab. 2022;24:1553–1564.
- Novo Nordisk. Wegovy US prescribing information. Revised June 2026. Sections 4–6 and 12. This is a scientific reference; local prescribing information governs UAE care.
- Esteghamati A et al. Optimal cut-off of HOMA-IR for the diagnosis of metabolic syndrome: Iranian national surveillance (SuRFNCD-2007). Nutr Metab. 2010;7:26.
- CARE. Case report checklist: patient information, timeline, diagnostic assessment, intervention, follow-up, patient perspective and consent.
- NIDDK. The A1C Test & Diabetes. HbA1c percentage and interpretation; normal range below 5.7%.
Scientific references reviewed 10 Oct 2026. Case-specific findings derive from the supplied clinical record and confirmed summary. Publication consent covers the first name, personal photographs, video and outcomes. The study uses the CARE reporting structure. Findings apply to this individual; outcomes vary.